Views: 43 Author: Site Editor Publish Time: 2023-10-24 Origin: Site
Since the beginning of this year, my country's export situation has been grim and complex. On the one hand, it is due to the downturn in the global economic and trade cycle. On the other hand, Europe and the United States have guided the relocation of industrial chains out of China, which has had a more significant impact on my country's exports.
Data show that since the beginning of this year, the share of U.S. imports from China has dropped to a historical freezing point, and China has also fallen to third place in the ranking of U.S. import share.
So, which countries or regions are mainly responsible for the decline in my country's share? How to view the industry structure characteristics behind industrial transfer? What impact will the tariff list introduced by the United States have on industry share and industrial transfer? How will this trend evolve in the future?

Changes in the overall share of U.S. imports from China
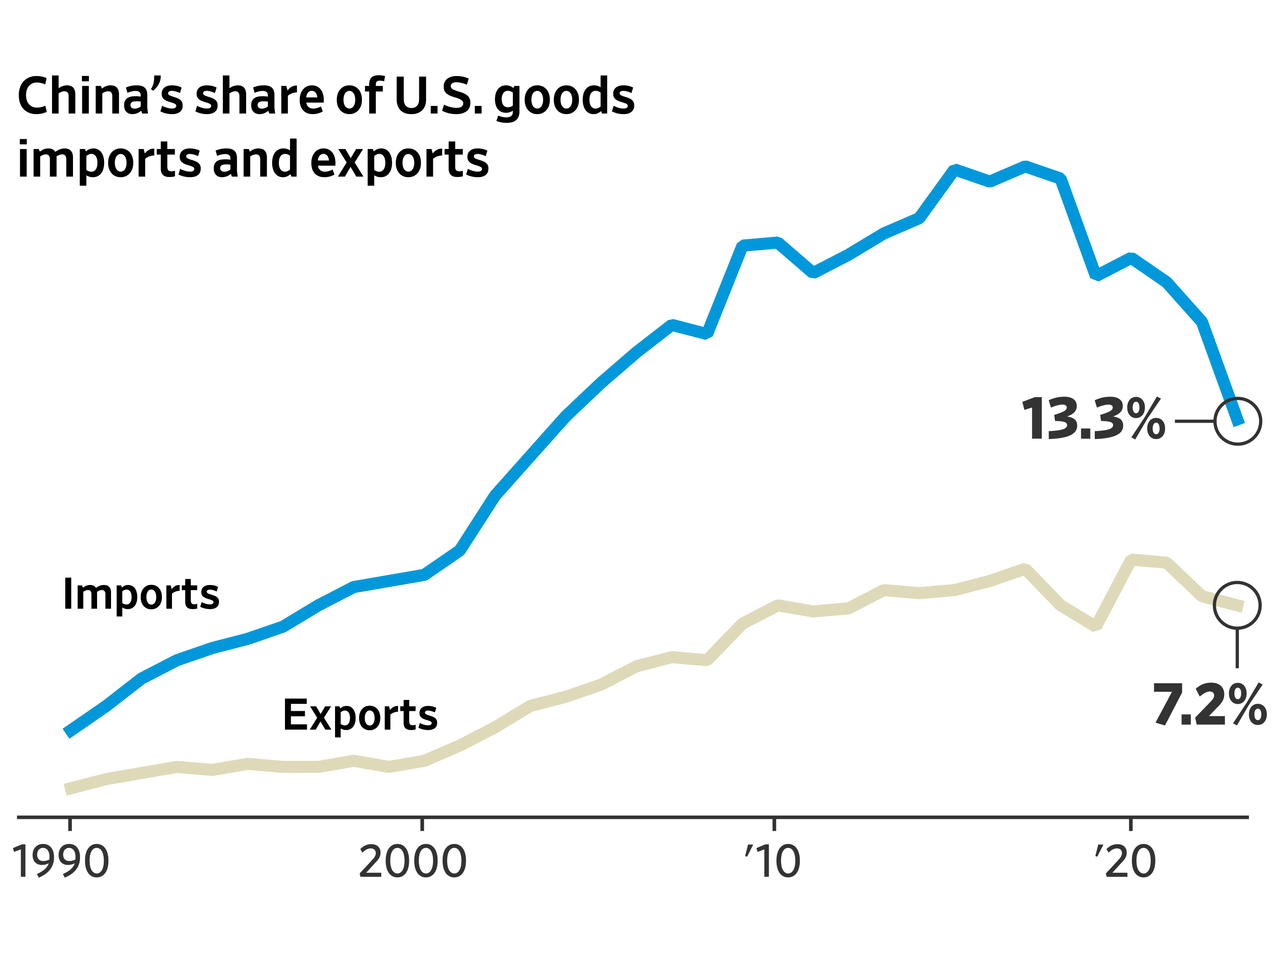
According to US media reports, friction between the United States and China is eroding trade relations between the world's two largest economies, and the proportion of goods from China in US imports has fallen to the lowest level in 20 years.
A Wall Street Journal analysis of trade data released by the U.S. Census Bureau shows buyers are turning to Mexico, Europe and other parts of Asia for goods ranging from computer chips to smartphones to clothing.
In the first six months of this year, China accounted for 13.3% of U.S. merchandise imports, down from a peak of 21.6% in 2017 and the highest level since 2003 (two years after China joined the World Trade Organization) of 12.1%. the lowest level.
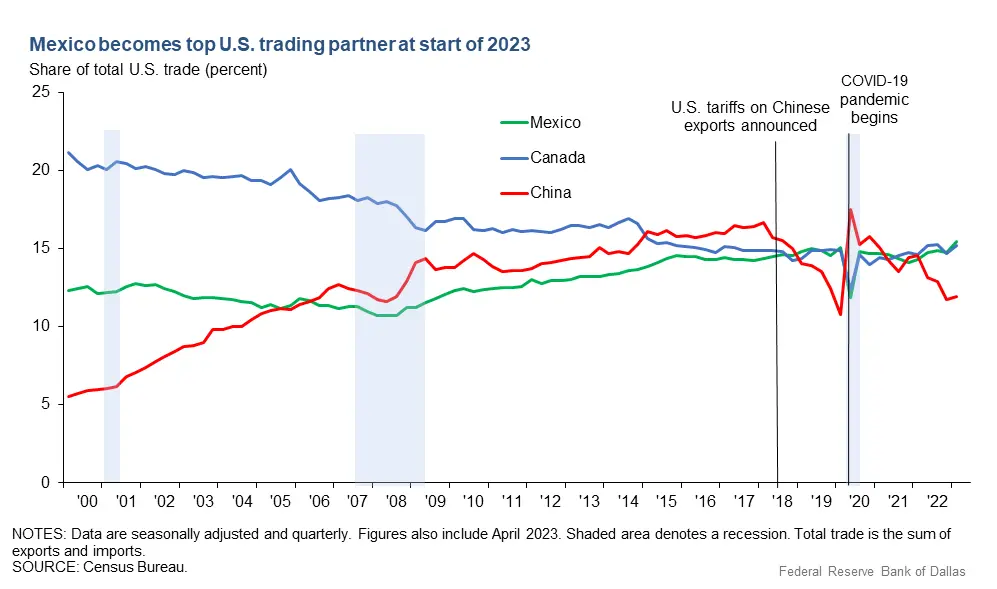
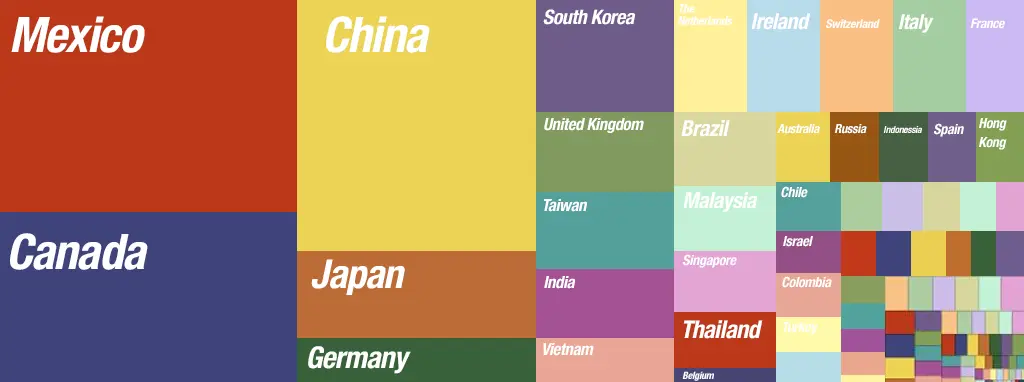
Data show that in the first half of the year, the United States imported $236 billion in goods from Mexico and $210.6 billion in goods from Canada. The total value of U.S. imports from China was $203 billion. Mexico surpassed China to become the largest trading partner of the United States.
2. Key nodes for changes in the share of U.S. imports from China
In 2019, China's exports to the United States fell by 12.5% year-on-year in 2018; from 2020 to 2022, affected by the epidemic, China's exports to the United States rose for three consecutive years, with a year-on-year increase of 27.5% in 2021, and the growth rate narrowed significantly in 2022 ; In the first three quarters of 2023, China's exports to the United States showed a significant decline, falling 16.4% year-on-year. This decline has exceeded that of 2018.
3. Which regions will mainly bear the decline in China’s overall share?
In fact, some Chinese industries have begun to relocate abroad since before 2018. However, since the share of U.S. imports from China in electromechanical, instrument and other industries has increased during this period, the overall share remains relatively stable.
Since 2019, affected by the Sino-US trade friction, the share of US imports from China has declined significantly, mainly shifting to ASEAN (31.3%) and the EU (40.0%).
Since 2023, the share of Canada and Mexico has increased significantly, and the share of North America (except the United States, the same below) has continued to accelerate.
However, as the share of U.S. imports from China has declined, China's share of exports to ASEAN, Russia, Central and Western Asia, and North Africa has increased significantly. Under the hedging effects of "re-exports" and export diversification, the actual impact of total exports has weakened.
Data show that from January to July this year, China's exports to the United States, Europe and Japan (calculated in US dollars, the same below) fell by 13.3% year-on-year, but total exports fell by 5.0% year-on-year, and exports to Russia and Central and Western Asia and North Africa increased significantly. To a certain extent, this has offset the rapid decline in total exports.
Since 2006, China's exports to ASEAN have achieved a three-level leap. Especially since 2016, the growth rate has accelerated, with a cumulative growth rate of 121.97% in six years.
Generally speaking, from a total volume perspective, due to the diversified hedging effect, China's overall export growth will not be as significant as the decline in the U.S. import share from China in the short term. However, from the perspective of the internal structure of exports, due to the impact of some industries on There is a strong dependence on US exports. This impact is more significant at the industry level and deserves more attention and discussion.
2. At the industry level, which product shares are falling faster?
Specifically, between 2010 and 2018, the decline in the share of U.S. imported products from China was mainly reflected in the light manufacturing and agricultural and sideline food industries.
Compared with 2010, the share of animal products, animal and vegetable oils, leather products, wood products, footwear and hat accessories, and artwork imported by the United States from China in 2018 all fell by more than 20%. For industries such as machinery and equipment, instrumentation, and other industries, the share is rising.
Between 2019 and 2023 (as of May 2023, the same below), the share of U.S. imports from China generally declined, and the changes were more dramatic. Except for animal and vegetable oils and special classifications, the import shares of other products have declined, and the share decline percentage of most products has been more than 30%. Among them, the share of mineral products, leather products, wood products, jewelry products, and artworks fell by more than 50%.
3. Which countries/regions are mainly responsible for the decline in the share of various products?
Specifically, from 2019 to 2023, the EU and India have accelerated their share of my country's light textile industry; affected by industrial reshoring, the proportion of North America's share of plastics, rubber, metal products, glass, ceramics and other products has increased significantly; Affected by the decentralized layout of the industrial chain of large consumer electronics multinational companies, ASEAN, while continuing to undertake the transfer of my country's light industry and textile industry, has also begun to actively lay out the machinery and instrumentation industry chain.
While ASEAN is taking over part of the U.S.'s import share from China, China's exports to ASEAN are also increasing significantly, and the "re-export effect" is obvious.
Before 2018, the decline in the share of China's exports to Europe and the United States was basically fully absorbed by ASEAN, which was reflected in the fact that the decline in the share of China's exports to Europe and the United States was smaller than the increase in the share of China's exports to ASEAN; since 2019, ASEAN has taken on the decline in the share of Europe and the United States. The weakening is reflected in the fact that the decline in the share of China's exports to Europe and the United States is greater than the increase in the share of China's exports to ASEAN.
3. Changing trends in the share of electromechanical equipment
We selected the electromechanical equipment category (machinery equipment, vehicle equipment, instruments and meters) for specific analysis.
Before 2018, the U.S. import share from China was still rising. Since 2019, affected by Sino-US trade frictions and the diversification of supply chain risks by large European and American multinational companies, the share has begun to shift overseas at an accelerated pace.
From the perspective of U.S. imports, before 2018, the share of electromechanical equipment imported by the United States from Canada and Japan dropped significantly, while the share of electromechanical equipment imported from Mexico, China, ASEAN and the EU increased significantly; starting from 2019, the U.S. The share of mechanical and electrical equipment products imported from China has dropped significantly. The share in 2023 (as of May 2023, the same below) will drop by 9.3 percentage points compared with the share in 2018 (a decrease of 35.9%). This is mainly caused by ASEAN, South Korea and taken over by India. In 2023, the share of U.S. imports of electromechanical equipment products from ASEAN, South Korea and India will increase by 4.0, 1.2 and 0.8 percentage points respectively compared with 2018, with increases of 54.9%, 28.8% and 103.3% respectively.
From the perspective of China's exports, from 2010 to 2018, the share of China's exports of machinery and equipment to the United States increased slightly by 1.3 percentage points, the share of exports to the EU fell by 4.4 percentage points, and the share of exports to ASEAN increased by 4.5 percentage points; starting from 2019 , the share of exports to the United States decreased, while the share of exports to ASEAN and the EU increased by 3.8 and 1.4 percentage points respectively.